So you’ve got your first Kubernetes (also known as k8s) cluster up and running. Congratulations! Now, how do you operate the thing? Deployments, replica sets, stateful sets, pods, ingress, oh my! Getting Kubernetes running can feel like a big enough challenge in and of itself, but does day two of operations need to be just as much of a challenge?
Kubernetes is an amazing but complex system. The learning curve can be steep. Plus, the standard Kubernetes dashboard has limited features. Another option is kubectl, which is extremely powerful but also a power user tool. Even if you become a kubectl wizard, can you expect everyone in your organization to do the same? And with kubectl it’s difficult to gain visibility into the general health and performance of the entire cluster all at once.
Enter k8dash—pronounced Kate Dash (/kāt,daSH/)—Indeed’s open source Kubernetes dashboard.
Since k8dash’s release in March of 2019, it’s received over 625 Github stars and been downloaded from DockerHub over 1 million times. k8dash is a key component of Kubernetes operations for many organizations.
In May of 2020, the Indeed Engineering organization adopted the k8dash project. We’re excited about the visibility this brings to the project.
Benefits of managing your Kubernetes cluster with k8dash
Here are a few of the benefits of k8dash. See more of k8dash in action here.
Quick installation
Low operational complexity is a core tenet of the k8dash project. As such, you can install k8dash quickly with a couple dozen lines of YAML. k8dash runs only a single service. No databases or caches are required. This extends to AuthN/AuthZ via OIDC. If you’re already using OIDC to secure your cluster, k8dash makes extending this to your dashboards easy: configure 2-3 environment variables and you’re up and running. No special authenticating proxies or other complicated configurations are required.
Cluster visualization and management
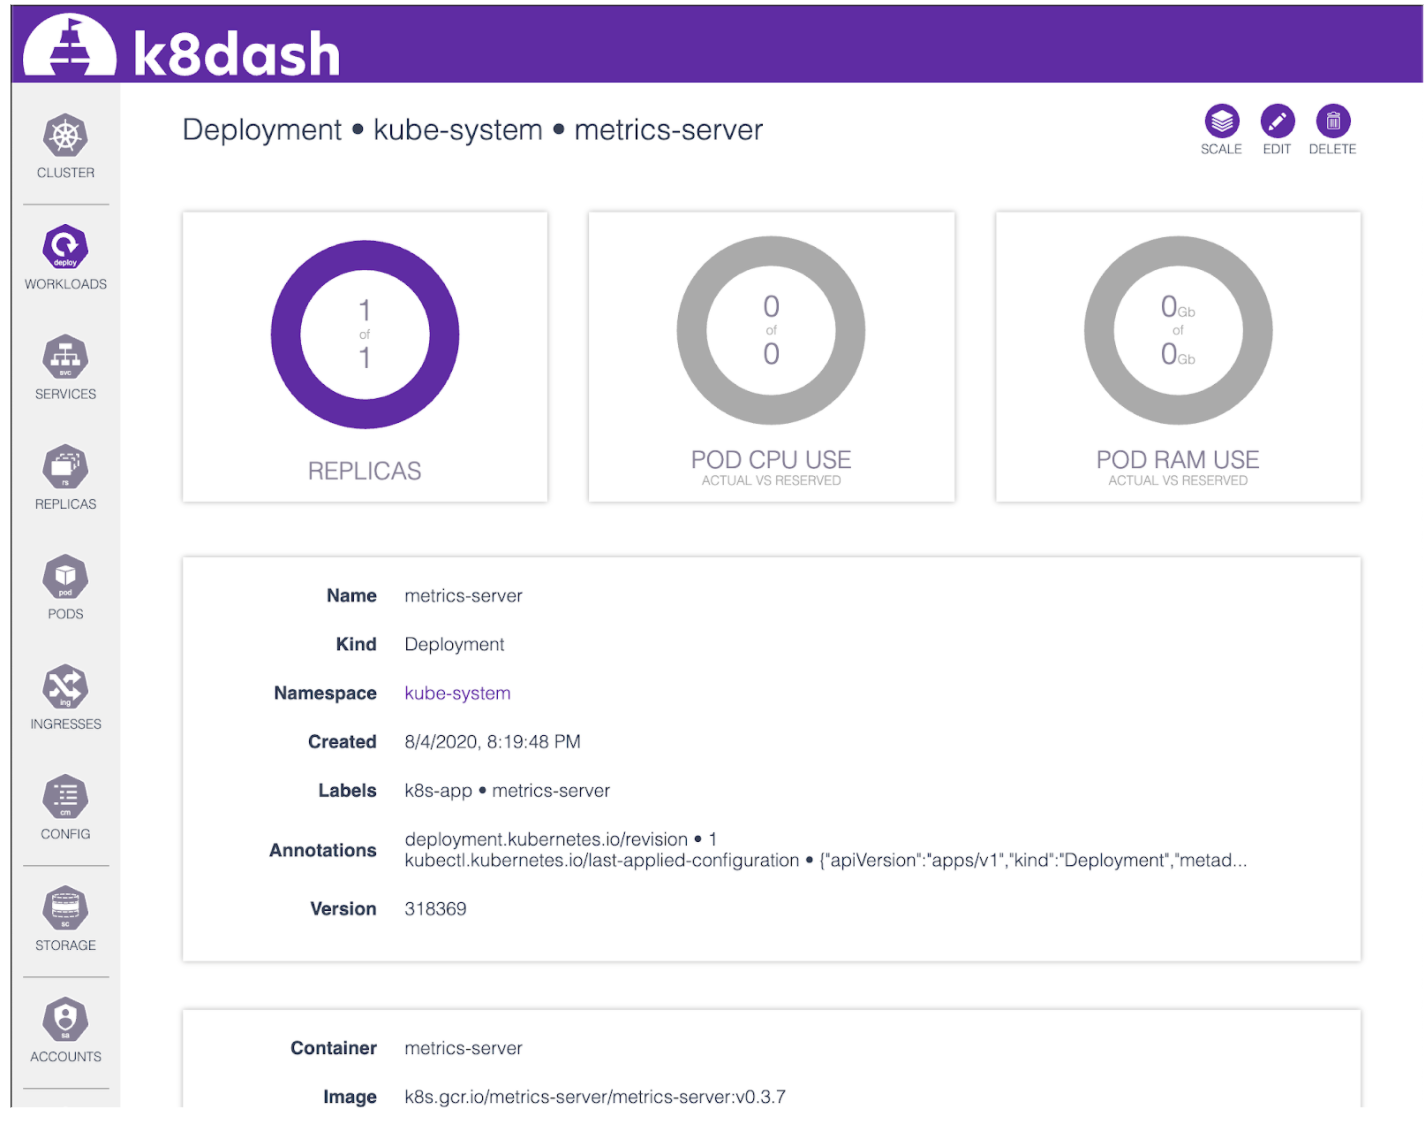
k8dash helps you understand the current status of all of your cluster’s moving parts: namespaces, nodes, pods, deployments. Real-time charts show poorly performing resources. The intuitive interface removes much of the behind-the-scenes complexity and helps flatten your Kubernetes learning curve.
You can manage your cluster components via the dashboard and leverage k8dash’s YAML editor to edit resources. k8dash uses the Kubernetes API and provides context-aware API docs. With k8dash you can view pod logs and even SSH directly into a running pod via a terminal directly in your browser, with a single click.
k8dash also integrates with Metrics Server, letting you visualize CPU/RAM usage. This visualization helps you understand how well your services are running. As Kubernetes simplifies the complexity of running hundreds or even thousands of microservices across an abstract compute pool, it brings the promise of improved resource utilization through bin packing. However, for many organizations this promise goes unrealized because it can be difficult to know which services are over- or under-provisioned. k8dash’s intuitive UI takes the guesswork out of understanding how well services are provisioned.
Real-time dashboard
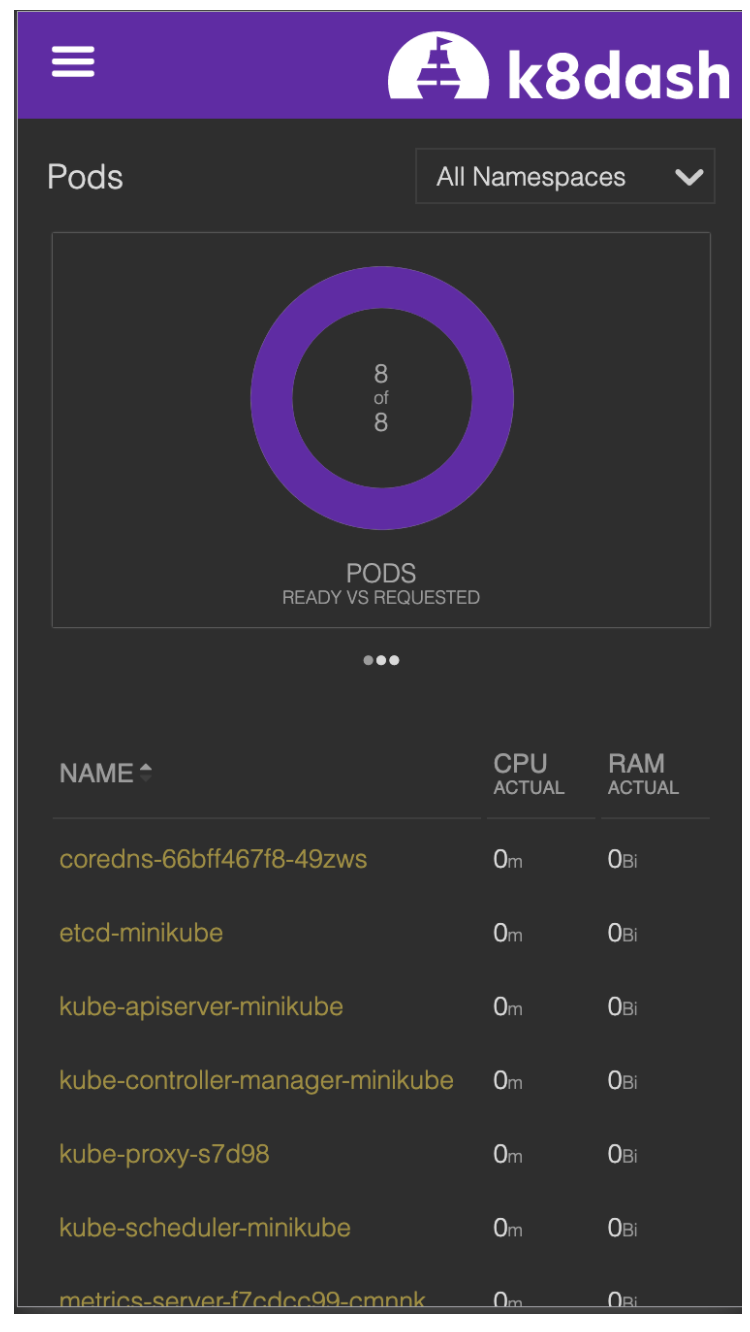
Because k8dash is a real-time dashboard, you don’t need to refresh pages to see the current state of your cluster. Instead, you can watch charts, graphs, and tables update in real time as you roll out a deployment. You can watch as nodes are added to and removed from your cluster, and know as soon as new nodes are fully available. Or, simply monitor a stream of Kubernetes cluster-wide events as they happen.
Because k8dash is mobile optimized, you can monitor—and even modify—your cluster on the go. If you’re getting paged about a troublesome pod just as your movie is about to start, with k8dash you can restart the pod directly from your phone!
The k8dash project: How to contribute
k8dash is made up of a lightweight server and a client, and we’re always looking for core contributors.
The server—built in Node.js and weighing in at ~150 LOC—is predominantly a proxy for the front end to the Kubernetes API server. The k8dash server makes heavy use of the following npm packages:
- express (web server)
- http-proxy-middleware (proxies requests to Kubernetes API)
- @kubernetes/client-node (official Kubernetes npm module. Used to discover Kubernetes API location)
- openid-client (fantastic npm module for OIDC)
The client is a React.js application (using create-react-app) with minimal additional dependencies.
If you would like to contribute, see the list of issues in GitHub.
About the author
Eric Herbrandson is a staff software engineer and member of the site reliability engineering team at Indeed. Eric has used orchestration frameworks, including ECS, Heroku, Docker Swarm, Hashicorp’s Nomad, DCOS (Marathon/Mesos), and Kubernetes. While finding Kubernetes to be the clear winner in the orchestration space, Eric recognized that existing visualization options were lacking compared to other frameworks. In an effort to better understand the Kubernetes API and to create a solution that contained all of the features he needed, Eric developed k8dash over a three-week period.