新しい UX の A/B テストをスピードアップするための7つの確かな方法

ホリスティックなユーザーエクスペリエンス (UX, User Experience) への再設計のための A/B テストには、困難が伴います。Indeed で UX を次のように変更しようとした時、 学んだことがあります。

job search ux v1-2

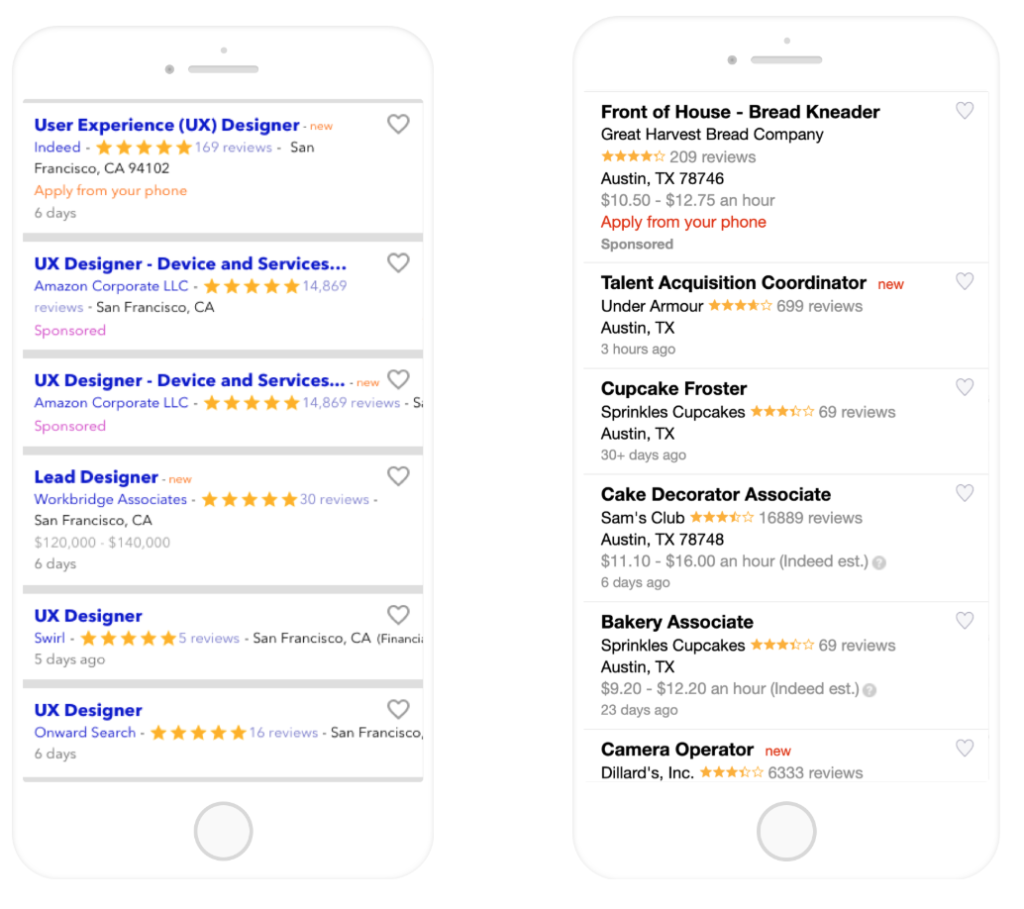
Indeed のモバイル版の検索結果ページ (SERP) 2017年中頃 (左)、2018年中頃 (右)

道のりは平坦ではありませんでした。見栄えの良いデザインの構想に数ヶ月費やし、さらに数ヶ月費やして、すべての変更を同時にテストしました。たくさんの指標が変動 (ほとんどが下降) し、どの UI の変更がどのような効果をもたらしたのかを把握できず、大混乱でした。

そこで、手法を変更することにしました。2018年の中頃、「できるだけ多くの UI 要素を科学的にテストし、Indeed の求人検索エクスペリエンスの原則を解明する」という目標を掲げ、複数のチームからメンバーを集め、Job Search UI (JSUI) Lab を立ち上げました。過去12か月間だけでも、52回以上のテストを行い、テストしたグループの数は502を数えました。以来、得られた知見を活かして、デスクトップとモバイルの両方のブラウザで求人検索 UX の改良を重ねています。

この記事で、2018 Indeed Engineering Innovation Award (社内の革新的なプロジェクトに授与される賞) を2018年に受賞した、JSUI Lab の、A/B テストをスピードアップする方法をいくつかご紹介します。UX の改善に関心がある方や、新しい機能を試したいという方は、これからご紹介する方法を A/B テストに取り入れてみてください。

#1: 十分なバックログを用意する

次のテストが決まらず、時間を無駄にしてしまうのは好ましいことではありません。開発者にとって、優先度の高い A/B テストのバックログが健全な量であれば、A/B テストはスムーズに進められます。

JSUI Lab では、四半期の最初の月に、チームのメンバー全員を集めてテストについてのブレインストーミングを行いながらバックログを作成します。現在のモバイル版とデスクトップ版の UX をピックアップし、各要素がどのように機能するか検証するのです。出て来た疑問やアイデアを、付箋に書き留めていきます。最終的に40個以上のアイデアが生まれ、求職者の問題点を解決できそうか、最小限の労力で設計システムを改善できるか、といった観点からテストの優先順位をつけました。バックログのテストをすべて実行することはできないかもしれませんが、少なくともやるべきテストが見つからない、という心配はなくなります。

#2: あらかじめ仮説を明記しておく

製品の開発に追われていると、A/B テストに対して自らが立てた仮説を事前に記載しておく時間が取れないことがあります。もちろん、仮説を書く作業を省くことで、テストの前に10~30分位は時間を節約できるかもしれませんが、数十件もの指標を検討し、次に何をすべきか決定する時、つまりテストが終了した時に痛い目を見ることになるでしょう。

ある指標は上昇し、別の指標は下降することで混乱が生じるだけではありません。たくさんの指標を考えれば考えるほど、おそらく誤検出 (第一種の過誤) も出てくることでしょう。「この UI 要素をオレンジから黄色に変えたら、求職者が採用担当者から連絡をもらえる確率にどう影響するだろうか」といった、テストの影響を受けない指標を考えてしまっている自分に気づくかもしれません。

こうならないためには、テストを行うことで変化が見られると思われる指標を3〜4個選び、各指標の検出力分析を行い、テストの仮説を記載しておきましょう。

#3: UI 要素を一つずつテストする

これには賛成できない、とおっしゃる方もいるでしょう。UI 要素を一つずつテストしたら、ホリスティックな UX への再設計に時間がかかり過ぎてしまうと思うかもしれません。しかし、UI 要素を一つずつテストしていくことで、実際には、より妥当な結論を導けました。それはなぜでしょうか? より明確に、因果関係を立証できたからです。

その結果、テストから得たすべての知見を、パフォーマンスアップにつながると確信できる一つの大きなテストに活かすことができました。ホリスティックな UX への再設計のためのテストを最初に行った時のように、指標が多過ぎて手に負えなくなるということはなく、2018年に Indeed が獲得した最も多くのユーザーエンゲージメントの一つとなったのです。かかった時間は、最初にテストした時の半分以下でした。

UI 要素を一つずつテストすることで、データに基づいて設計ビジョンを再現でき、ホリスティックな UX のためのテストを成功させることができました。

SERP 2019

2019年中頃のモバイル版の Indeed の検索結果

では、これらのテストは、実際にはどのように行われていたのでしょうか。以下は、テストグループの例です。違いは、フォントサイズやスペースなど、わずかなものであることがわかると思います。
tests

#4: 多変量テストを考慮する

多変量テスト (または「要因テスト」) では、A/B テストの各要因について、考えられるすべての組み合わせをテストするので、A/B/C/D/E/… テストのようになります。各要因を一つずつテストしていたら見逃してしまっていたかもしれない組み合わせを見つけられるのが、多変量テストの利点です。

この利点は、JSUI Lab の例からもわかります。UX のリサーチを通じて、求職者が求人の詳細を見るときに、本当に知りたいのは給与であることがわかりました。そこで、2018年に、検索結果に給与を次のように表示しました。

account coordinator listing

色、フォントサイズ、太字によって視覚的に目立たせることで、検索結果に対する求職者のエンゲージメントが上昇するかどうかを確かめたかったのです。4種類のフォントサイズ、4種類のカラーバリエーション、太字かそうでないかの2種類を用意しました。4 x 4 x 2で合計32グループです。

account coordinator tests

多変量テストにより、UI 要素ごとに結論を出すスピードを速めることはできますが、欠点がないわけではありません。最初に、統計的検出力のトレードオフ、あるいは特定の効果が存在する場合にそれを検出する可能性 (第二種の過誤) を考慮する必要があります。統計的検出力が不十分だと、テストの効果があったとしても、それを検出できないというリスクが生じるのです。

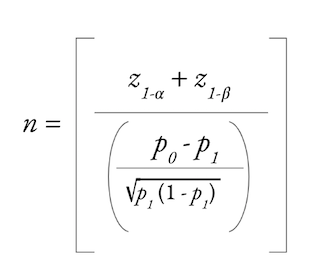
検出力の計算は閉形式であり、プロダクトチームは、α レベルと β レベルの選択、サンプルサイズ (n)、処理による効果量 (p1) のうち、どれを優先するか決めなければなりません。Indeed では、2億2千万人以上の月間ユニークユーザー数が強みです。あなたのチームのトラフィックはこれより少ないかもしれません。そのため、確実に検出したい効果の大きさによっては、十分な統計的検出力を得るためにテスト期間を長めに設定したり、グループへの割り当てを増やしたり、一部のグループは除外したり、第一種の過誤の増加を考慮しなければならないかもしれません。

closed form calculation
2つの比率の検出力テストである閉形式の計算

典型的な A/B テストの場合、通常は t 検定による比較的単純な分析です。多変量テストでは、多変量回帰モデルを使用して、特定の変数の効果とその交互作用を調べることができるでしょう。単純化した回帰方程式がこちらです。

simplified-regression-equation

さらに、私たちが行ったテストのうち一つの回帰方程式の例はこちらです (求人カードのフォントサイズとスペースを修正したもの)。

job card regression equation

多変量テストに関するもう一つの注意事項は、すぐに実行不可能になる場合があるという点です。2つのレベルを持つ10個の要因がある場合、2の10乗の多変量テストを行うことになり、テストグループは1,024個にもなります。このような場合、一部実施要因テストの実施の方が、意味があるかもしれません。

多変量テストでは、おもしろい組み合わせが表れることがあります。前述の給与の例で、給与のパターンを16ポイント、緑、太字のフォントにしたとき、Indeed の UX Design チームはあまりいい顔をしませんでした。私たちは、このパターンを「ハルク」という愛称で呼びました。アクセシビリティを考慮して、パターンを実行できないことがあるかもしれません。JSUI Lab では、統計的厳密さと引き換えにユーザーエクスペリエンスが一時的に低下しても良しとするか、ケースバイケースで判断しています。

sw engineer listing

#5: CSS および JavaScript の変更を別々にデプロイする

従来のデプロイサイクルでは、新しい機能をすばやくテストするには不都合なこともあります。Indeed では CrashTest というツールを開発し、デプロイサイクルを回避できるようにしました。CrashTest は、メインコードベースの「フック」に投入される CSS や JavaScript ファイルのコードベースに依存しています。CrashTest のフックのインストールは標準的なデプロイの通りですが、フックが設定されると、新しい CSS や JavaScript の処理を投入でき、数分後には変更によるプロダクトへの影響を確認できます。

JSUI Lab では、Design Technologist のクリスティーナが、数十個のグループ用の CSS や JavaScript の処理を担当しています。CrashTest があれば、クリスティーナは機能を作成し、QA はコーリーに頼めます。Indeed の オープンソーステスト管理プラットフォーム、Proctor を使えば、その日のうちにテストを開始させることができます。従来のデプロイサイクルで動いていれば、クリスティーナの作業の成果が求職者の目に触れるまでにもう数日を要し、A/B テストの結果が出るまでさらに長い時間がかかったでしょう。

#6: 民主的な A/B テストプラットフォームを持つ

テストの成果を把握するために、ログとテーブルを隅々までチェックするのは、賢い時間の使い方とは言えません。それより、チームで使える A/B テストプラットフォームを構築するか、購入することを検討しましょう。データを重視する Indeed には、TestStats という社内ツールがあります。このツールは、各テストグループが主要な指標に対してどのような効果があったか、テストが既定の効果量から有意義な結論を導き出せるだけの統計検出力を備えているかを教えてくれます。テスト結果を他の人と共有したり、議論したりするのに便利なツールです。

#7: クロストレーニングで全員のスキルをレベルアップする

JSUI Lab は、全員が平等にチームの決定に貢献することで、チームがより上手く機能すると確信しています。チームメートは、Product Manager、UX Designer、QA Engineer、Data Scientist、Program Manager、Design Technologist です。各自がユニークなバックグラウンドを持ち、それをチームに還元しています。日常業務の中で自分のスキルをお互いに教え合うことで、共通する言葉で会話ができるようになるため、A/B テストがスピードアップします。

たとえば、私は Product Scientist で、A/B テストのトレーニングを行いました。結果として、毎回私が直接指示しなくても、 JSUI Lab の全員がテストの設計を判断できるようになってきています。UX Designer のケイティは、Product Manager の CJ やケヴィンがテストを行う際の手順をそばで見ながら覚えました。今では、ケイティは自分でテストを行っています。このようなクロストレーニングは、チームにおける「バス因子」を減らすだけでなく、チームメートが自分の専門分野をマスターし、知識への自信を深める方法として非常に優れているのです

さあ、テストを始めましょう!

紹介した7つのヒントのうちのどれか一つ、あるいは全部を取り入れれば、A/B テストのスピードがアップするでしょう。JSUI Lab は、こうした簡単な手順を社内の他のチームにシェアし始めています。皆さんの会社でも幅広く応用できると思います。ぜひお試しください。

A/B テストの方法論に関して熱意をお持ちの方は、Indeed で一緒に働きませんか?
The Evolving Language of Data Science 

…or Grokking the Bokeh of Scarse Meaning Increasement

“You keep using that word. I do not think it means what you think it means.” — Dr. Inigo Montoya


I’m a technical writer at Indeed. One of the many great things about my job is that I get to work with smart people every day. A fair amount of that work involves translating between them. They will all be speaking English, but still might not understand each other. This is a natural consequence of how knowledge advances in general, and how English develops in particular. 

As disciplines evolve, alternate meanings and new words develop to match. That can extend to creating new phrases to name the disciplines themselves (for example, what is a data scientist?). English’s adoption of such new words and meanings has always been pragmatic. Other Western languages have more formal approval processes, such as French’s Académie française and German’s reliance on a single prestigious dictionary. The closest to formal authorities for correct English are popular dictionaries such as the Oxford English Dictionary, the American Heritage Dictionary, and Merriam-Webster. None of them reign supreme.

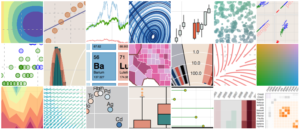
This informal adoption of new words and meanings can lead to entire conversations in which people don’t realize they’re discussing different things. For example, consider another recently adopted word: “bokeh.” This started as a term in the dialect of professional photography, for the aesthetically pleasing blurred look that strong depth of field can give a picture. “Bokeh” is also the name for a specific python data visualization package. So “bokeh” may already be headed for a new meaning within the realm of data science.

As a further example of the fluid nature of English, “bokeh” comes from the Japanese word boke (暈け or ボケ). In its original form it meant “intentional blurring,” as well as sometimes “mental haze,” i.e., confusion.


A row of lowers that becomes blurry in the distance, for the word "bokeh" A montage of various images relating to the data science usage of "bokeh"

Bokeh of flowers

Photo by Sergei Akulich on Unsplash

Data science bokeh

https://bokeh.pydata.org/ 

The clouded meaning of “data”

A data scientist told me that when she hears “the data” she tends to think of a large amount of information, a set large enough to be comprehensive. She was surprised to see another team’s presentation of  “the data” turn out to be a small table inside a spreadsheet that listed a few numbers. 

This term can also cause confusion between technical fields. Data scientists often interpret “data” as quantitative, while UX researchers interpret “data” as qualitative.

Exploring evolving language with Ngram Viewer

A product science colleague introduced me to the Google Books Ngram Viewer. It’s a search engine that shows how often a word or phrase occurs in the mass of print books Google has scanned. Google’s collection contains most books published in English from AD 1500 to 2008.

I entered some new words that I had come across, and screened out occurrences that weren’t relevant, such as place or person names and abbreviations. I also set the search to start from 1800. Medieval data science could be interesting, but I expect it to be “scarse.” (That’s not a typo.)

Features

When I first came across this newer meaning of “features,” I wasn’t even aware that it had changed. From previous work with software development and UX, I took “features” to mean “aspects of a product that a user will hopefully find useful.” But in data science, a “feature” relates to covariates in a model. In less technical English, a measurable property or characteristic of a phenomenon being observed. 

This dual meaning led me to a fair amount of head-scratching when I was documenting an internal data science application. The application had software features for defining and manipulating data features. 

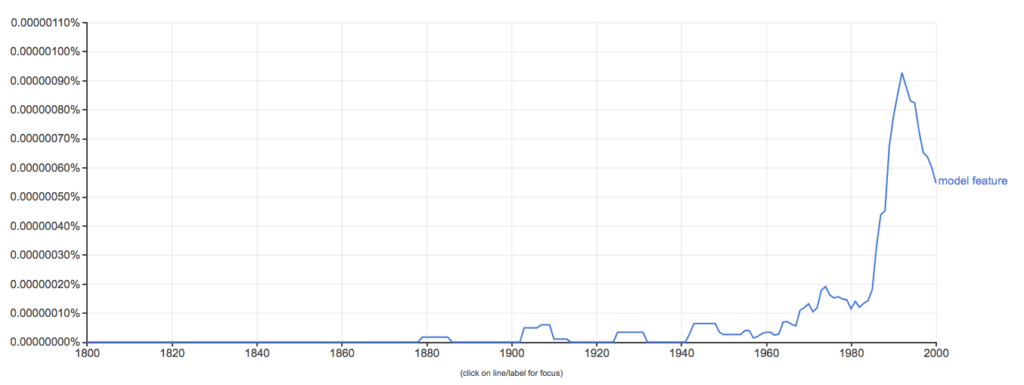
The following graph indicates this emerging meaning for “feature” by tracking the emergence of a related phrase, “model feature.” 

Ngram graph for the phrase "model feature"

Diving into Ngram’s specific citations, the earliest mention I can find that’s near this meaning is in 1954. Interestingly, it’s from a book on management science:

Screenshot from Google Books summary of "Management Science"

The next use that seems exact turns up in 1969, in the Digest Record from Association for Computing Machinery, Society for Industrial and Applied Mathematics, Institute of Electrical and Electronics Engineers. Leaving aside the intervening comma, the example is so dead-on that I wonder if we’re looking at near the exact moment this new meaning was fully born:

Screenshot of Google Books summary for "The Digest Record"

To grok

“Grok” is an example of English going so far as to steal words from languages that don’t even exist. Robert A. Heinlein coined the word in his 1961 science fiction classic Stranger in a Strange Land. In the novel, the Martian phrase “grok” literally means “drink” and metaphorically means “understanding something so completely that you and it are one.” 

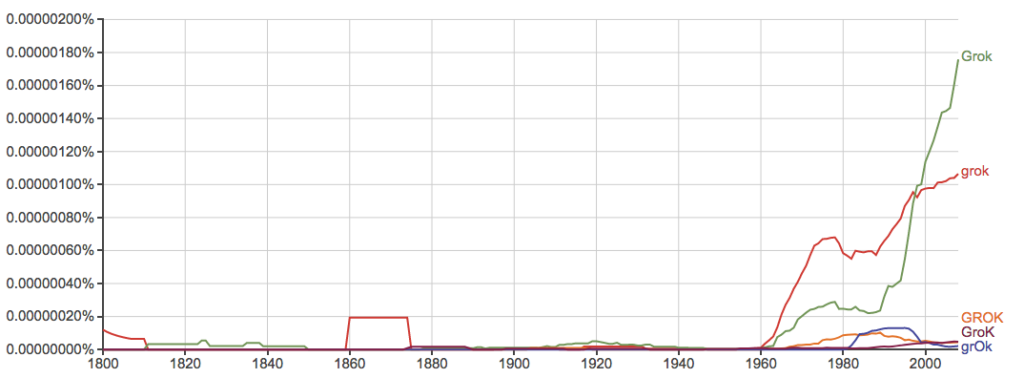
Ngram graph for the word "grok"

Like many other aspects of science fiction and fantasy, computer programming culture absorbed the term. The Jargon File from 1983 shares an early defined example:

GROK (grahk) verb.
  To understand, usually in a global sense especially, to understand
all the implications and consequences of making a change. Example:
“JONL is the only one who groks the MACLISP compiler.”

Since then, computer jargon has absorbed “grok” and applied it in many different ways. One immediate example is the source code and reference engine OpenGrok. It’s intended to let users “grok (profoundly understand) source code and is developed in the open.”

Salt

Salt is an example of a common word that has gone through two steps of technical change. First it gained a meaning relating to information security, and then an additional one in data science. 

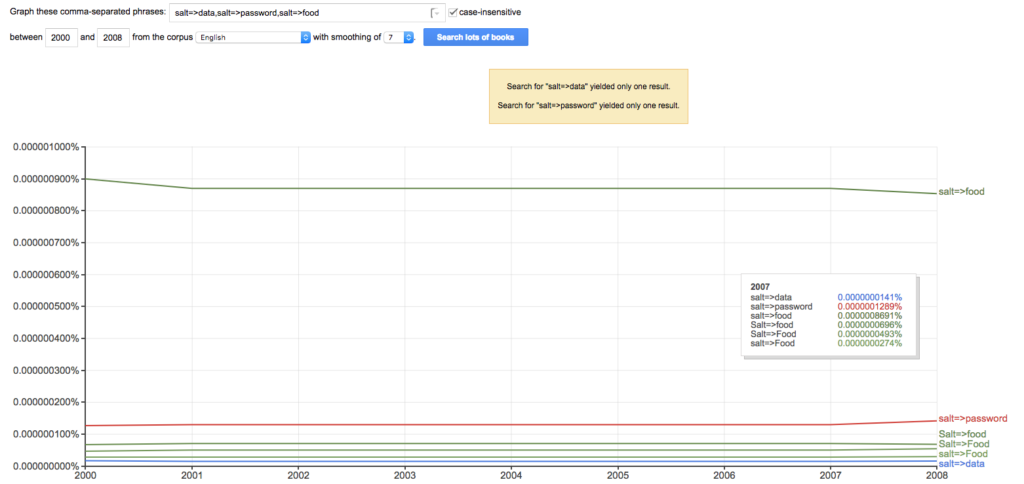
As a verb and noun, “salt” originally meant what it sounds like – adding the substance chemically known as NaCl to food for flavoring and preservation. It gained what is perhaps its better-known technical meaning in information security. Adding “salt” to password hashing makes encrypted passwords more difficult to crack. In the word’s further and more recent permutations in data science, “salt” and “resalt” mean to partly randomize the results of an experiment by shuffling them. The following ngram graph tracks the association of “salt” and “resalt” over time. 

This was hard to parse out, and required diving deeply into Ngram’s options. I ended up graphing the different times “salt” modifies the words “food,” “password,” or “data.” Google stopped scanning in new books in 2008 – you can see the barest beginning of this new usage in 2007.

Ngram graph for the word "salt"

Pickling

Traditionally “pickling” refers to another way to treat food, this one almost entirely for preservation. In Python, this refers to the object serialization method made possible by the Pickle module. Data scientists have found increasing use for this term, in ways too recent to find on Ngram.

The bleeding edge of language?

Here are some words that may just be in the sprouting stage of wider usage.

Scarse

This came from an accidental jumble of words in a meeting, and has remained in use since. It describes situations where data is both scarce (there’s not a lot of it) and sparse (even when there is some, it’s pretty thin). 

This meaning for “scarse” doesn’t appear in the Ngram graph. So it appears we’re seeing mutation and evolution in word form in the wild. Will it take root and prosper, continuing to evolve? Only time will tell.

Increasement

“We should look for the source of that error message increasement.”

I’ve observed this word once in the wild–from me. “Increasement” came to me in a meeting, as a word for the amount of an increase over time. I had never used the word before. It just seemed like a word that could exist. It had meaning similar to other words, and fit those other words’ rules of word construction.

In the context I used, its meaning isn’t exactly the same as “increment.” Increment refers to a specific numeric increase. One wouldn’t refer, for example, to an increasing amount of users as an increment. You might, however, refer to it as an increasement.

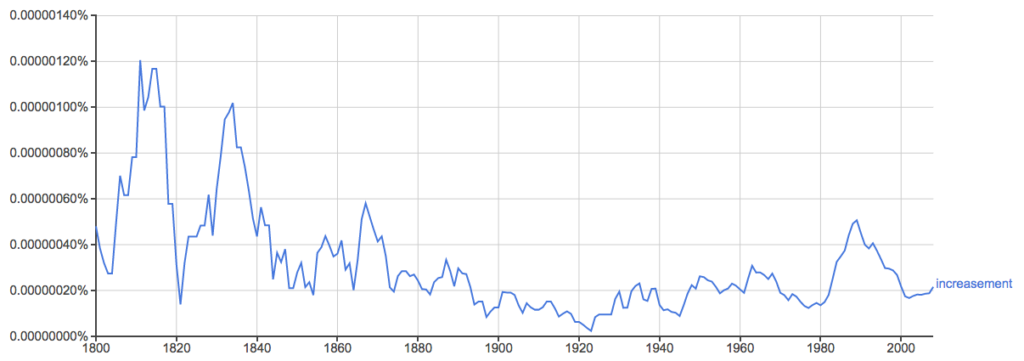
Searching for increasement revealed that this word previously existed but fell out of common usage, as shown on the following graph.

Ngram graph for the word "increasement"

Previous examples:

The Fathers of the English Church

Paul was, that he should return again to these Philippians, and abide, and continue amongst them, and that to their profit; both to the increasement of their faith


The Harleian miscellany; or, A collection of … pamphlets and tracts … in the late earl of Oxford’s library

….when she saw the man grown settled and staid, gave him an assistance, and advanced him to the treasurership, where he made amends to his house, for his mis-spent time, both in the increasement of his estate and honour…

Perhaps it’s time for “increasement” to be rebooted into common use?

Bottom line

Language is likely to continue evolving as long as we use language. Words in general, and English words in particular, and words in English technical dialects above all, are in a constant state of flux. Just like the many fields of knowledge they discuss.

So if you’re in a technical discussion and others’ responses aren’t quite what you expect, consider re-examining the technical phrases you’re using. 

The people you’re talking with might grok those words quite differently.

ベースラインと適切な指標によってクラス不均衡を認識する

私は大学で初めて受けた機械学習の授業で、レコメンダシステムを構築しました。ソーシャルミュージックサイトのデータセットを使って、ユーザーがアーティストを気に入るかどうか予測するモデルを作成したのです。最初の実験では、データセットの99%に対して正しいレーティングを与えたので、私は高揚しました。間違いはたった1%だったのです。

自信満々で教授に結果を報告しましたが、そこで自分が機械学習の天才ではないことを思い知らされたのです。私が犯した失敗は、「base rate fallacy (基準率の無視)」と呼ばれるものでした。私が使用したデータセットは、極端なクラス不均衡を示していました。言い換えると、ユーザーとアーティストの組み合わせのうちの99%が、ユーザーが好んでいないアーティストだったのです。世界中には無数のミュージシャンがいて、おそらく誰も、その半数も知らないでしょう。そもそも気に入るかどうか以前の問題です。

class imbalance

注意していないと、クラス不均衡は、ミスリーディングな評価指標につながる問題を引き起こします。大学生だった私は、真正面からこの問題にぶち当たりました。正解率だけでは、何も知ることができないのも同然です。ある自明な予測モデルが「すべてのユーザーはどのアーティストも気に入らない」という予測をした場合、正解率は99%に達するかもしれませんが、そこには何の価値もありません。正解率を指標にした場合、すべてのエラーは同程度のコストを伴うという前提になりますが、実際はそうでないことが多いのです。

医療を例に挙げて考えてみましょう。腫瘍を見て、誤って悪性だと診断し、さらに精密なスクリーニングを行った場合、この誤診の代償は、患者の不安と医療従事者の時間です。反対に、良性だと診断した腫瘍が実際は悪性だった場合、患者は命を失ってしまうかもしれません。

クラスの分布を検証する

不均衡の問題に関して、正解率以上に考えるべき指標は数多くあります。まずは、クラスの分布を知ることが最初の関門です。プラーティ、バティスタ、シルバの3人は、経験則からあることに気づきました。それは、データセットに占める少数派クラスの割合が10%以上の場合、クラス不均衡がパフォーマンスを著しく損なうわけではないということです。データセットにこれ以上の不均衡がある場合は、特別な注意を払う必要があります。

まずは、きわめて単純なモデルから始めることをお勧めします。最も頻度の高いクラスを選びましょう。scikit-learn が DummyClassifier で実装しています。私が音楽のレコメンダプロジェクトを作成した時にこれを行っていれば、自分のモデルが実際には何も学んでいないことにすぐ気づいたでしょう。

コストを評価する

検出漏れや誤検出の正確なコストを計算できれば理想的です。モデルを評価する際、これらのコストに検出漏れと誤検出の割合を掛け合わせれば、モデルの誤分類コストを表す数値が得られるはずです。あいにく、これらのコストは現実世界では未知であることが多いです。誤検出の割合を改善すれば、たいてい真陽性率に害を及ぼします。

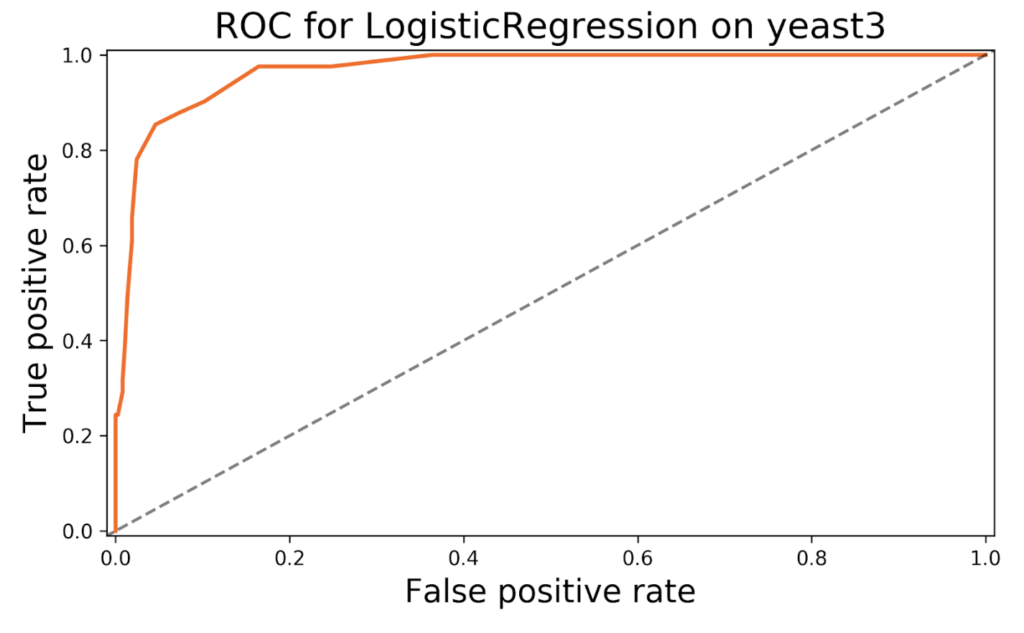
このトレードオフは、ROC 曲線を使って可視化できます。たいていの分類器は、各クラスに対する確率を出力することが可能です。閾値 (例: 50%) を一つ固定すれば、閾値を超える確率を持つデータ点が、すべて正のクラスに属すると考えることができます。確率の低いものから高いものまで閾値を変化させると、異なる真陽性率と誤検出率を持つ分類基準が得られるでしょう。誤検出率を X 軸とし、真陽性率を Y 軸として、ROC 曲線が求められます。

たとえば、私は KEEL の yeast3 データセットで分類器をトレーニングし、ROC 曲線を作成しました。

ROC for LogisticRegression on yeast3

ROC 曲線を描くためのコードを自分で記述することも可能ですが、Yellowbrick ライブラリにはこの機能が組み込まれています (さらに、scikit-learn モデルとも互換性があります)。これらの曲線は、モデルの閾値をどこに設定すべきかの参考になるでしょう。さらに、この曲線より下の部分の面積を使って、複数のモデルを比較することもできます (良い指標とはならない場合もありますが)。

次に機械学習の問題に取り組む時は、目的変数の分布について考えてみてください。クラス不均衡の問題を解決する最初の大きな一歩は、問題を認識することです。より適切な指標を用い、可視化することで、不均衡の問題について、より明確な議論ができるようになります。

クラス不均衡についての詳細

ODSC West では、クラス不均衡が生じる原因について、より深く掘り下げてお話するつもりです。このエラーに対処する方法についても、色々と探ってみたいと思います。それでは10月にお会いしましょう!